ChartDB
Your Database, Finally Visualized
Listed in categories:
DatabaseGitHubDeveloper Tools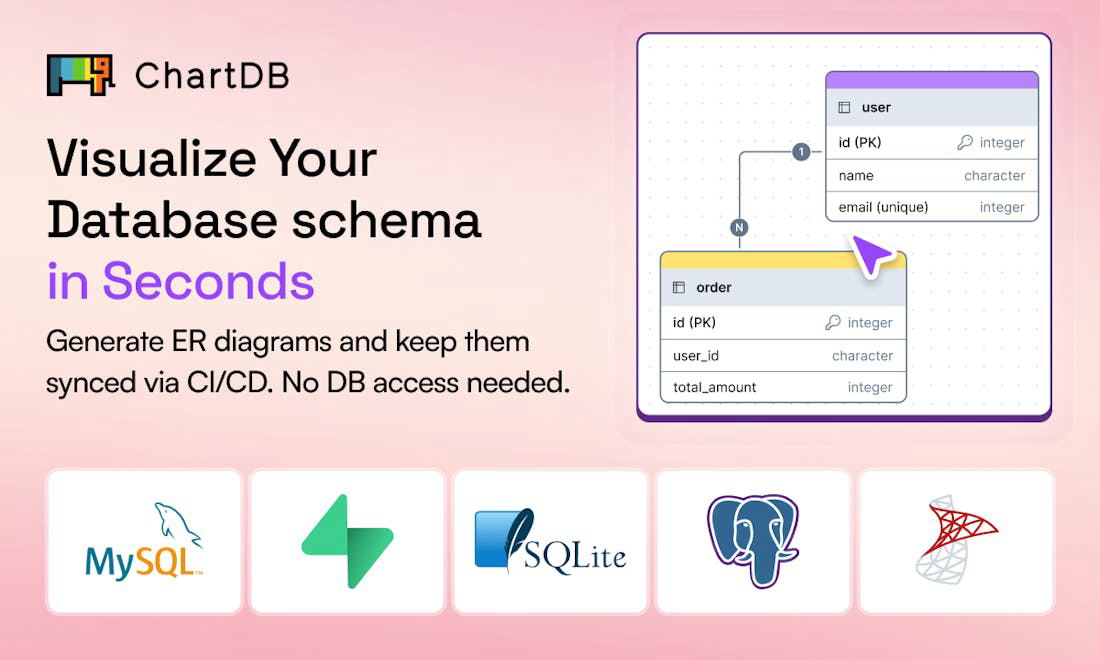

Description
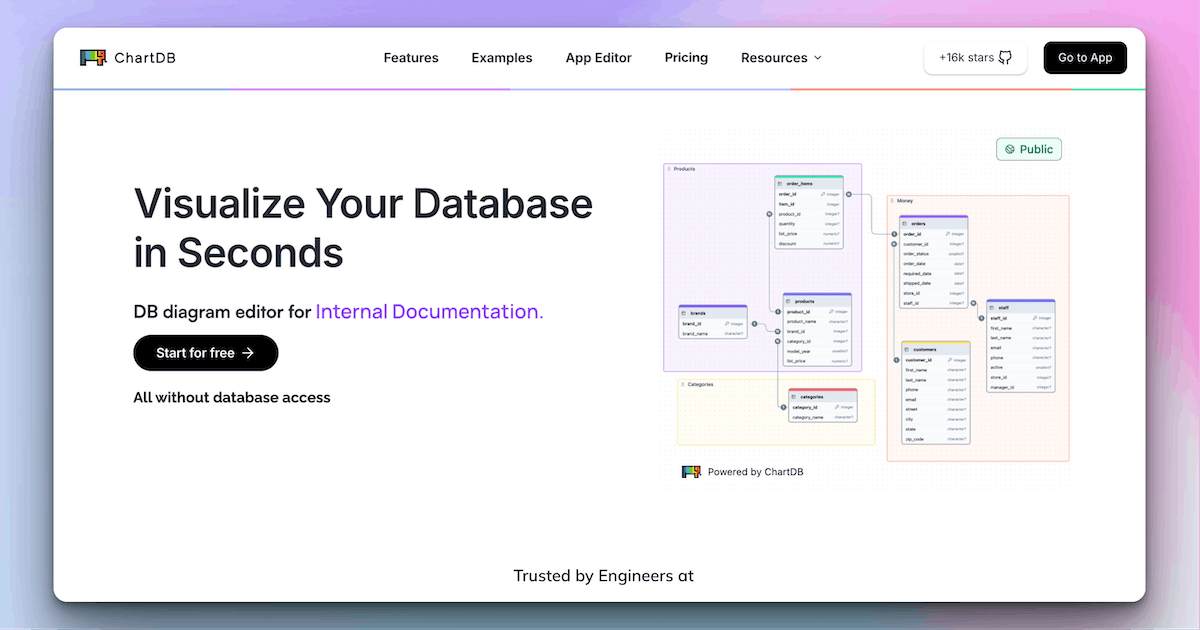
ChartDB is a powerful database diagram editor that allows users to visualize their database schemas instantly in their browser. It is designed for team collaboration, enabling real-time editing and sharing of diagrams without requiring direct database access. With features like automatic synchronization with live databases and the ability to generate clean SQL DDL scripts, ChartDB simplifies the process of database management and migration.
How to use ChartDB?
To use ChartDB, simply import your database schema using a single query, which takes just 15 seconds. You can then edit, collaborate, and export your diagrams as needed.
Core features of ChartDB:
1️⃣
Instant database schema visualization
2️⃣
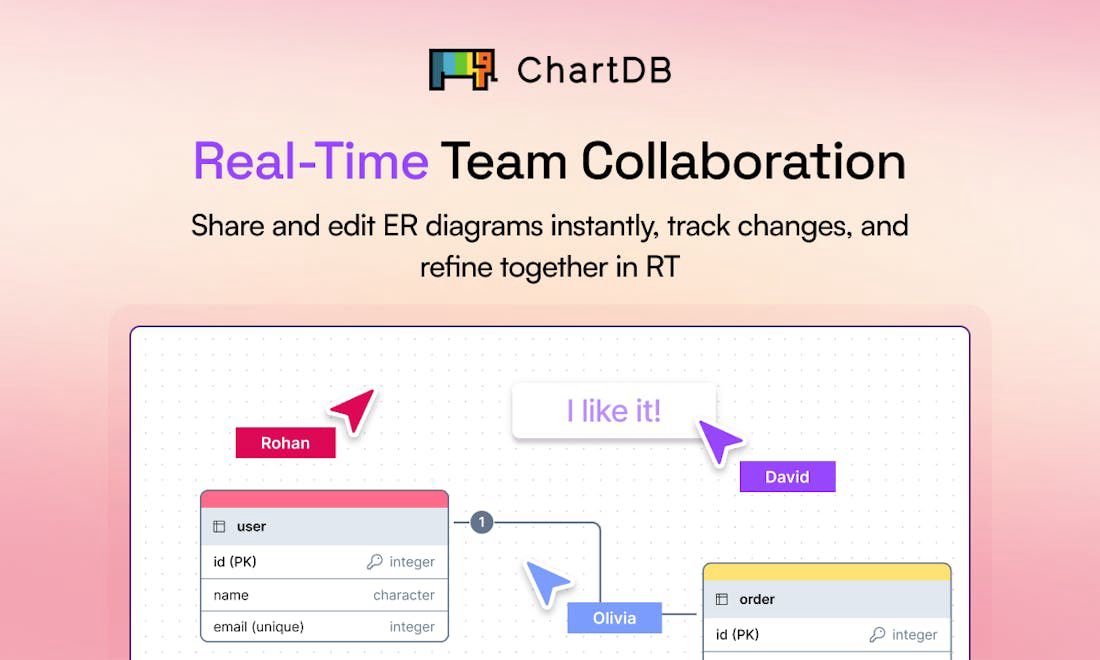
Real-time collaboration for teams
3️⃣
Automatic synchronization with live databases
4️⃣
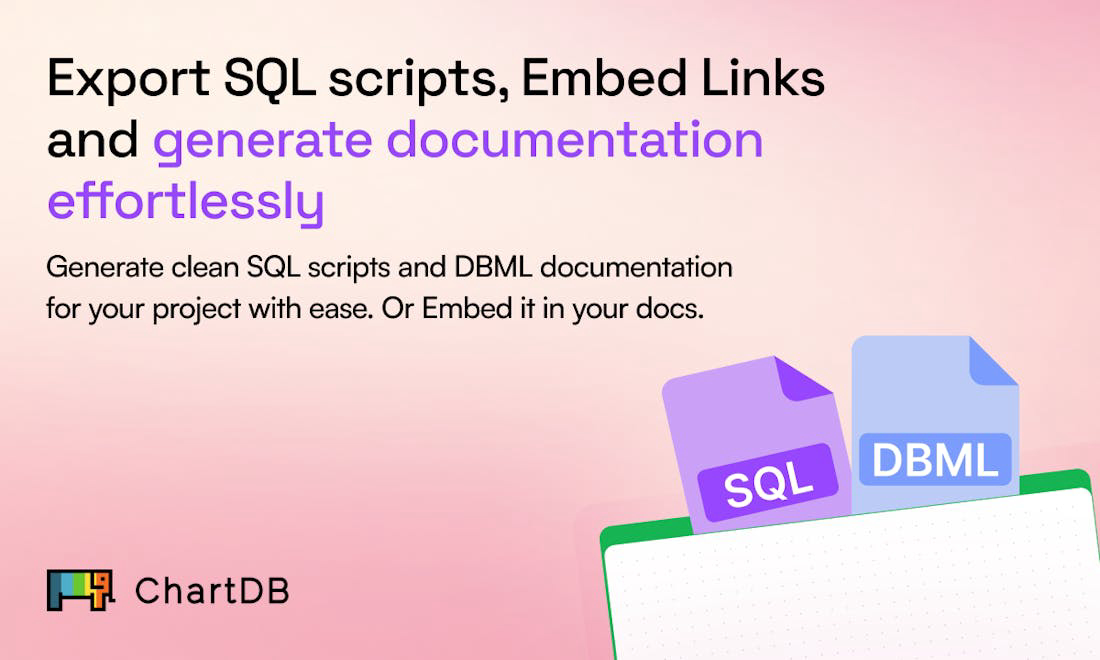
Export diagrams as SQL DDL scripts or images
5️⃣
Pre-designed examples for quick setup
Why could be used ChartDB?
| # | Use case | Status | |
|---|---|---|---|
| # 1 | Visualizing complex database schemas for better understanding | ✅ | |
| # 2 | Collaborating with team members on database design | ✅ | |
| # 3 | Migrating databases with ease using visual tools | ✅ | |
Who developed ChartDB?
ChartDB is developed by a team of engineers dedicated to providing powerful tools for database visualization and management. Their focus is on creating user-friendly solutions that enhance productivity and collaboration for software teams.